

API Analytics
API Analytics is the dashboard's view of how the APIs behind your Gateways are actually performing: how much traffic they're taking, how fast they're responding, and how often they're failing.
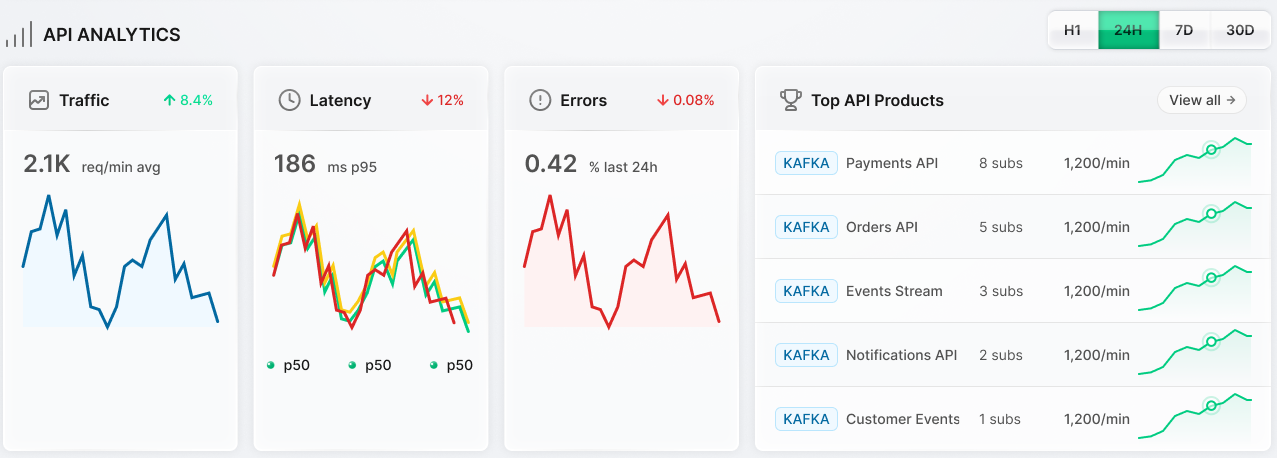
What You Can See
- Traffic: request throughput (req/s), tracked over the selected window.
- Latency: response time in milliseconds.
- Errors: the share of requests that failed over the selected window.
- Recent Activity: a live feed of traffic per API Product, by protocol.
Each widget can be viewed over a short or long window (1H, 24H, 7D, or 30D), so a spike right now and a slower week-over-week trend are both visible from the same view.
When to Use It
Check API Analytics after deploying a new API Product version or attaching a new Gateway, to confirm traffic is flowing and error rate hasn't regressed. A rising p95 latency or error rate here is the cue to check the underlying Gateway Group's health and configuration, or the Kafka cluster it's backed by.
Next Steps
- API Products covers deploying and versioning the products this traffic belongs to.
- Stream Ops covers the Kafka-side throughput and lag behind this API traffic.