

Kafka Clusters
Once a Kafka cluster and Schema Registry are attached to an environment through a Gateway, Zilla Console gives you comprehensive visibility into it, letting you monitor brokers, topics, schemas, and other critical components, as well as track usage patterns in real time.
Select Kafka Clusters in the left navigation to see every cluster attached to the current environment.
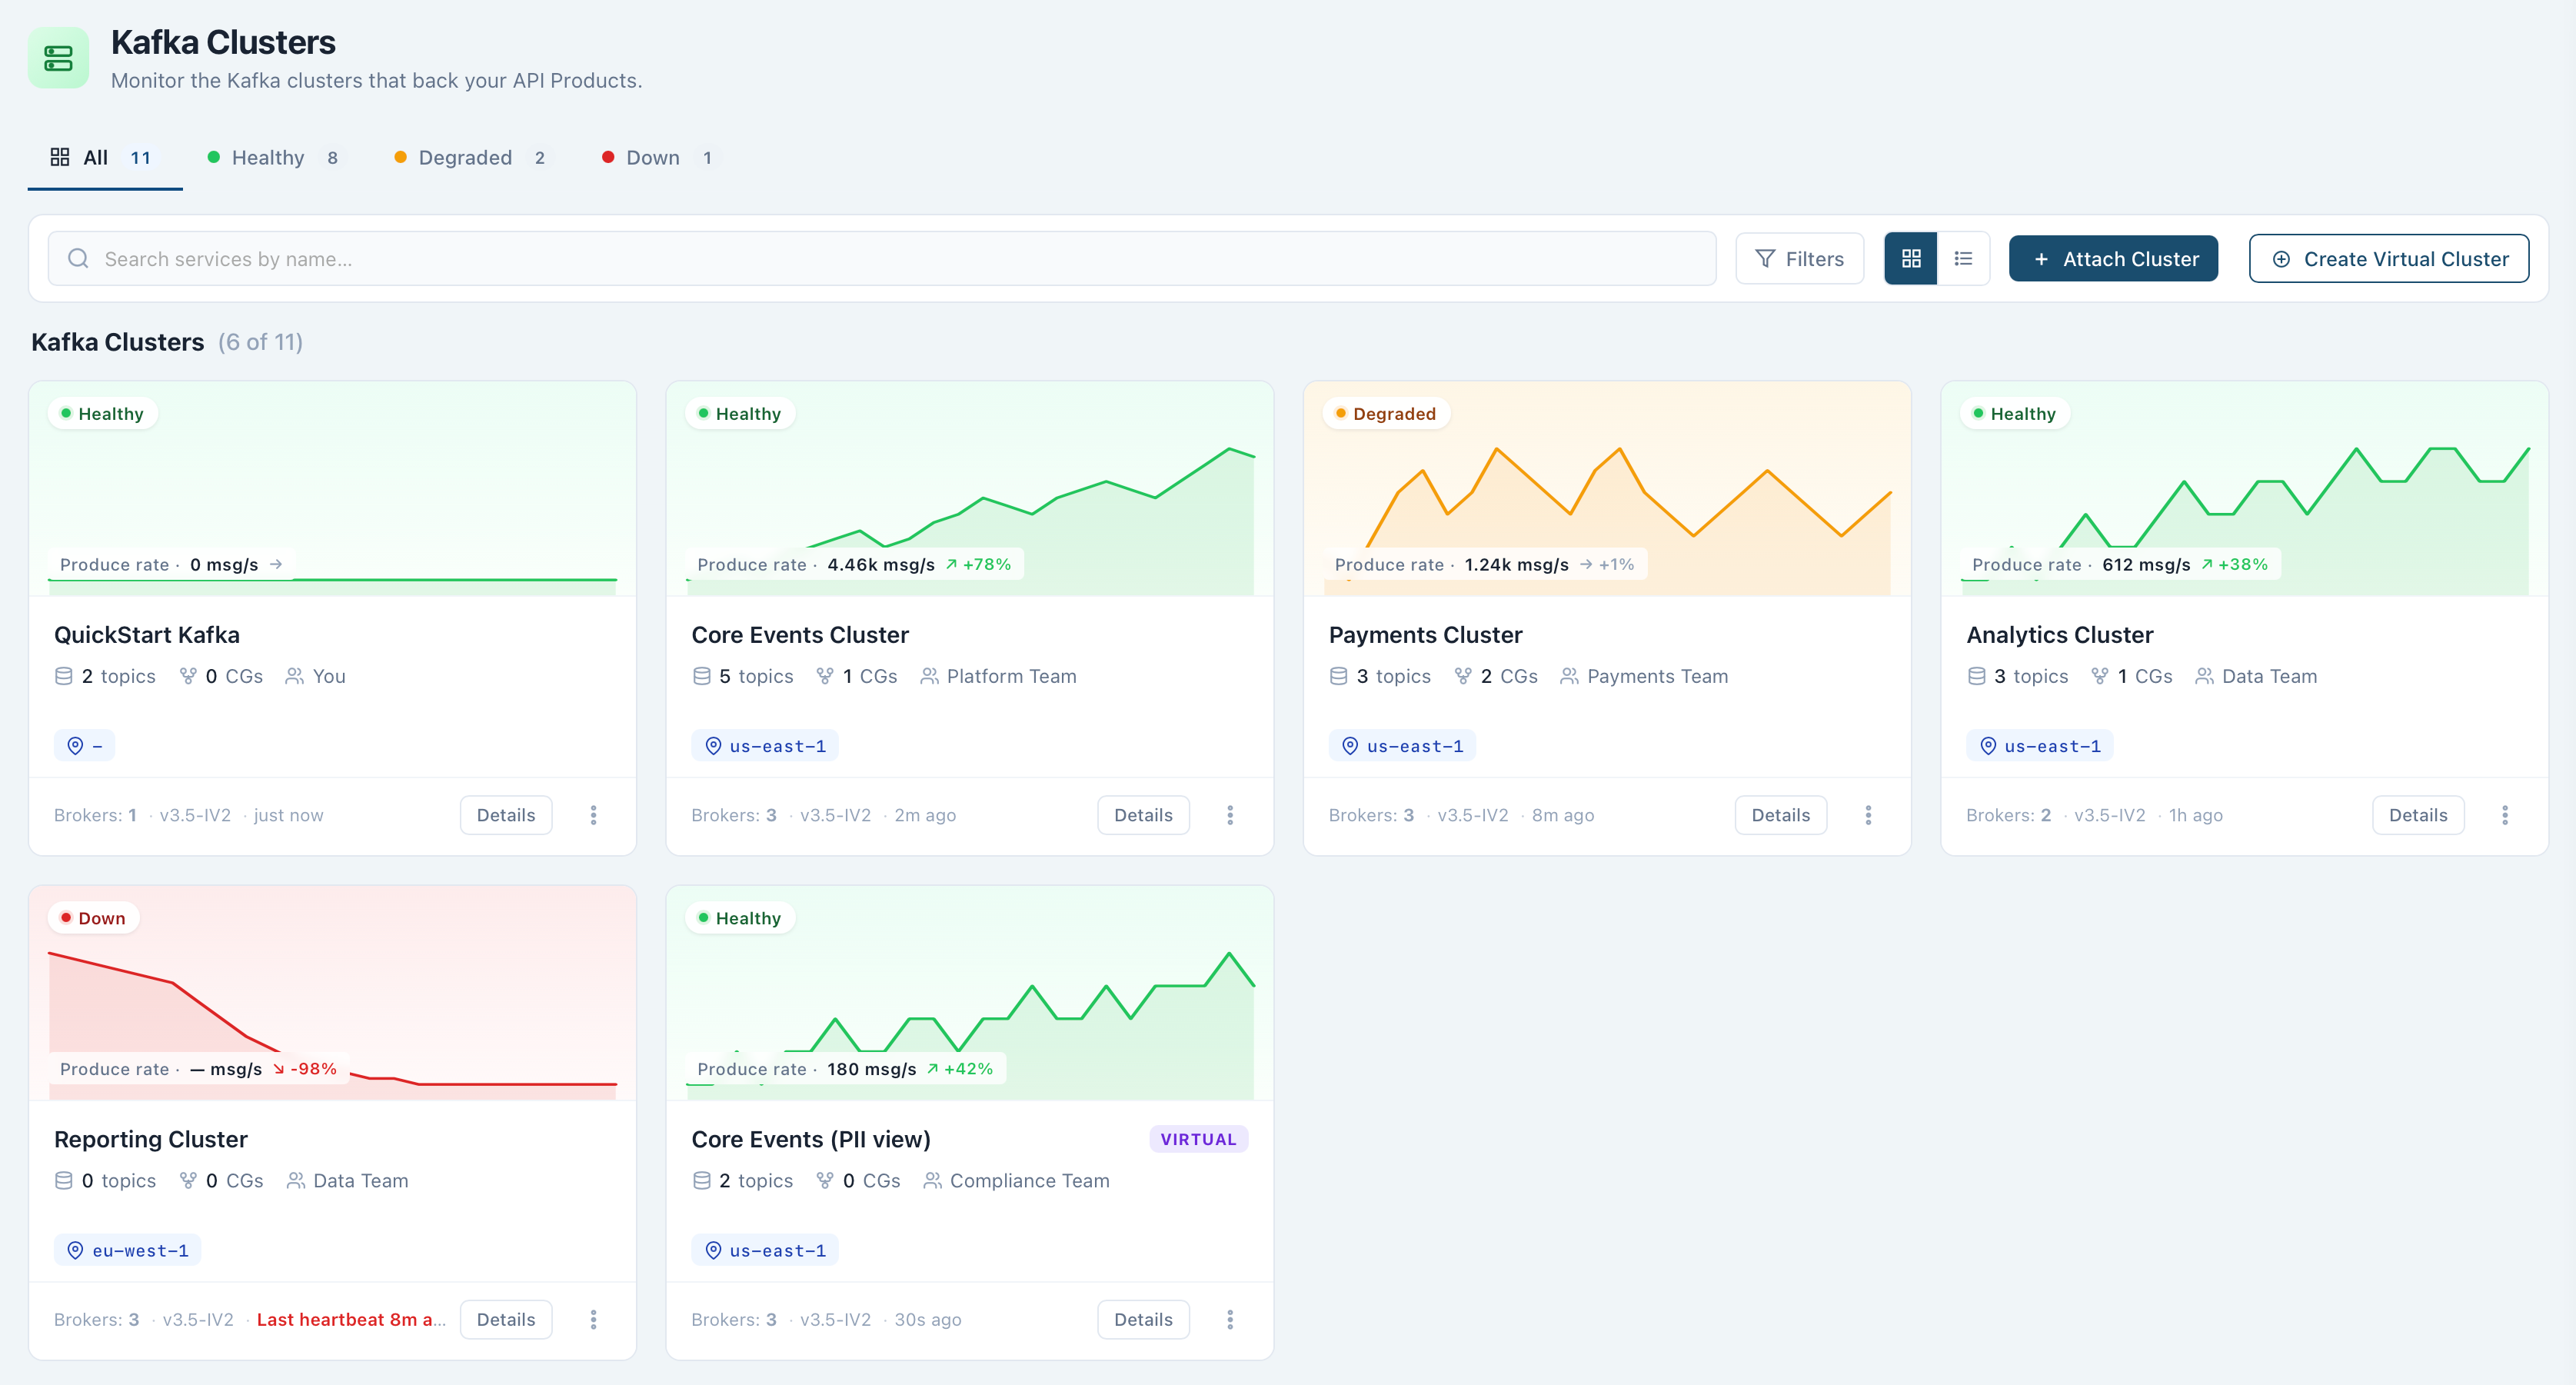
The Clusters List
Each attached Kafka cluster appears as a card showing its health (Healthy, Warning, Down, or Unknown), a produce-rate sparkline, its topic count, consumer group count, owning team, and region, with its broker count, Kafka version, and last activity along the footer. Filter by health status or search by name, and switch to a table view for the same data in columns.
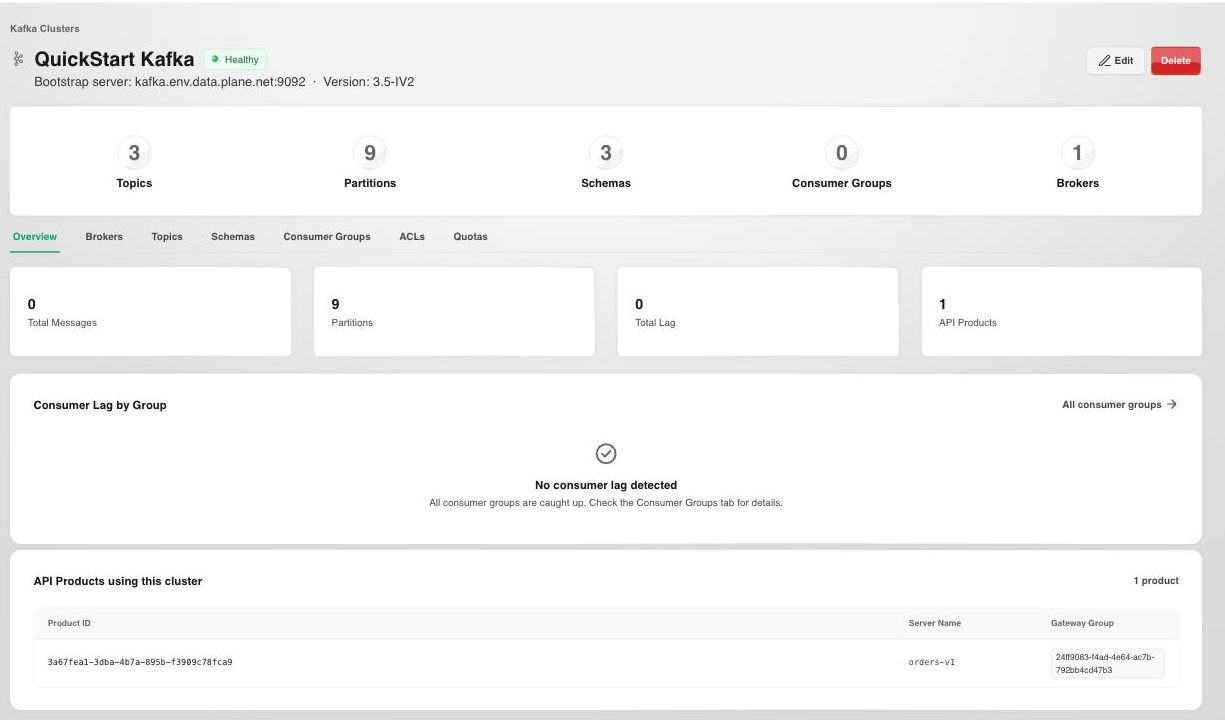
The card's row menu offers Details, Edit cluster, Copy cluster ID, and Copy connection string. Selecting a cluster opens its bootstrap server address and version, alongside the detail tabs below.
Attach a Cluster
Use Attach Cluster to connect an existing Kafka cluster to the environment, or Create Virtual Cluster to partition a single physical cluster into isolated namespaces per tenant.
Attaching a cluster asks for:
- Display Name and an optional Description.
- Bootstrap Server: the cluster's bootstrap address, for example
{server}.kafka.example.com:9092. - Authentication:
None,SASL/PLAIN,SASL/SCRAM-256,SASL/SCRAM-512, ormTLS. These credentials are what the Gateway presents to the brokers on behalf of your API Products.- The SASL mechanisms take a Username and Password.
mTLS(and any TLS-secured broker) takes PEM material: a Client certificate chain and its Client private key, plus optional Broker CA certificates used to verify the broker's own server certificate. The private key is write-only: it's stored on save and never returned by the API. Attaching an mTLS cluster without a certificate and key is rejected.
- Schema Registry URL (optional), with its own username and password if the registry is secured. Leave it empty to run without a Schema Registry: API Products can still validate messages against their AsyncAPI specification.
A Virtual Cluster is created against an already-attached physical cluster, and can carry Policies from the moment it's created.
What You Can See
- Overview summarizes the cluster's topic, partition, schema, and consumer group counts, its highest-lag consumer groups, and the API Products served from it.
- Brokers show the operational state of every Kafka broker in the cluster.
- Topics lists every Kafka topic, its configuration, structure, and health.
- Consumer Groups shows how messages are being consumed across topics.
- ACLs lists the access control entries that define which principals can perform specific operations on cluster resources.
- Quotas displays throughput limits applied to producers and consumers.
- Schemas lists every message schema registered with the cluster's Schema Registry.
Cluster- and topic-level governance rules are managed as Policies, attached to a Virtual Cluster or Gateway Group rather than to the cluster's own tabs.
Next Steps
- Policies covers the governance rules that apply across the clusters and Gateway Groups in an environment.
- API Catalog covers packaging a topic from this cluster into a governed API Product.